Email Threat Review September 2022
Executive Summary
HTML is now the most used file type in email attacks with attachments.
Summary
In this monthly email threat review installment, we present an overview of the email-based threats observed in September 2022 and compare them to the previous month’s threats.
The report provides insights into the following highlights:
- Unwanted emails by category
- File types used in attacks
- Industry Email Threat Index
- Attack techniques
- Impersonated company brands and organizations
- Highlighted threat email campaigns
Unwanted emails by category
The following table shows the distribution of unwanted emails per category.
| Email category | % |
| Rejected | 78.25 |
| Spam | 15.75 |
| Threat | 3.91 |
| AdvThreat | 2.04 |
| Content | 0.04 |
The following histogram shows the email volume per category per day.

Methodology
The listed email categories correspond to those listed in the Email Live Tracking of Hornetsecurity’s Control Panel. So our users are already familiar with them. For others, the categories are:
| Category | Description |
| Spam | These emails are unwanted and are often promotional or fraudulent. The emails are sent simultaneously to a large number of recipients. |
| Content | These emails have an invalid attachment. The administrators define in the Content Control module which attachments are invalid. |
| Threat | These emails contain harmful content, such as malicious attachments or links, or they are sent to commit crimes like phishing. |
| AdvThreat | Advanced Threat Protection has detected a threat in these emails. The emails are used for illegal purposes and involve sophisticated technical means that can only be fended off using advanced dynamic procedures. |
| Rejected | Our email server rejects these emails directly during the SMTP dialog because of external characteristics, such as the sender’s identity, and the emails are not analyzed further. |
File types used in attacks
The following table shows the distribution of file types used in attacks.
| File type (used in malicious emails) | % |
| HTML | 31.1 |
| Archive | 23.0 |
| 12.3 | |
| Word | 10.2 |
| Disk image files | 8.2 |
| Executable | 4.2 |
| Excel | 3.7 |
| Script file | 3.2 |
| Other | 4.0 |
The following histogram shows the email volume per file type used in attacks per 7 days.

This month, HTML attachments have become the most commonly used file type in attacks with attachments. Excel macro documents are still in decline.
Industry Email Threat Index
The following table shows our Industry Email Threat Index calculated based on the number of threat emails compared to each industry’s clean emails (in median).
| Industries | Share of threat in threat and clean emails |
| Research industry | 6.0 |
| Media industry | 4.9 |
| Manufacturing industry | 4.6 |
| Mining and metal industry | 4.6 |
| Entertainment industry | 4.2 |
| Healthcare industry | 4.1 |
| Retail industry | 4.1 |
| Construction industry | 4.1 |
| Information technology industry | 3.9 |
| Utilities | 3.8 |
The following bar chart visualizes the email-based threat posed to each industry.
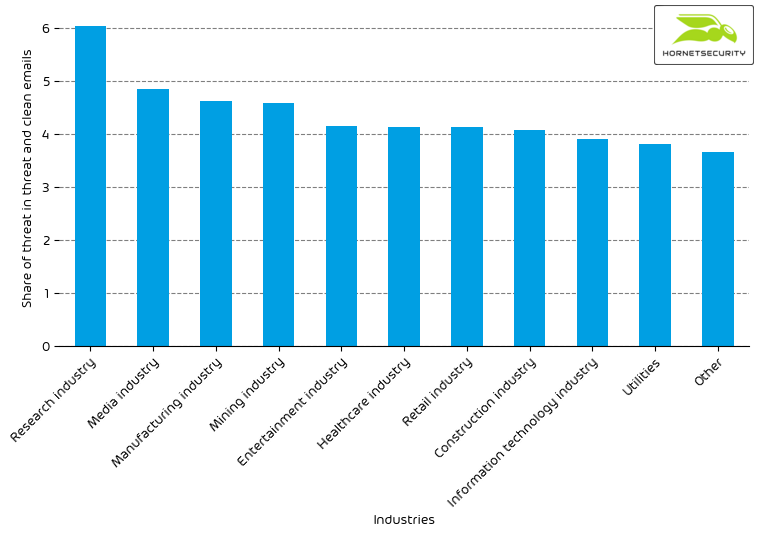
With an Industry Email Threat Index of 6.0, the research industry remains at the top position. The education industry, which ranked 3rd last month, fell sharply from 4.3 to 3.8, thus not making the top 10 anymore. The mining and metal industry saw a significant increase from 3.4 to 4.6, making it enter the top 10 at place four from the previous month’s 14th place.
Overall the Email Threat Index across all industries increased compared to last month. This is expected as the summer month with summer holidays usually causes a drop in threat emails sent.
Methodology
Different (sized) organizations receive a different absolute number of emails. Thus, we calculate the percent share of threat emails from each organization’s threat and clean emails to compare organizations. We then calculate the median of these percent values for all organizations within the same industry to form the industry’s final threat score.
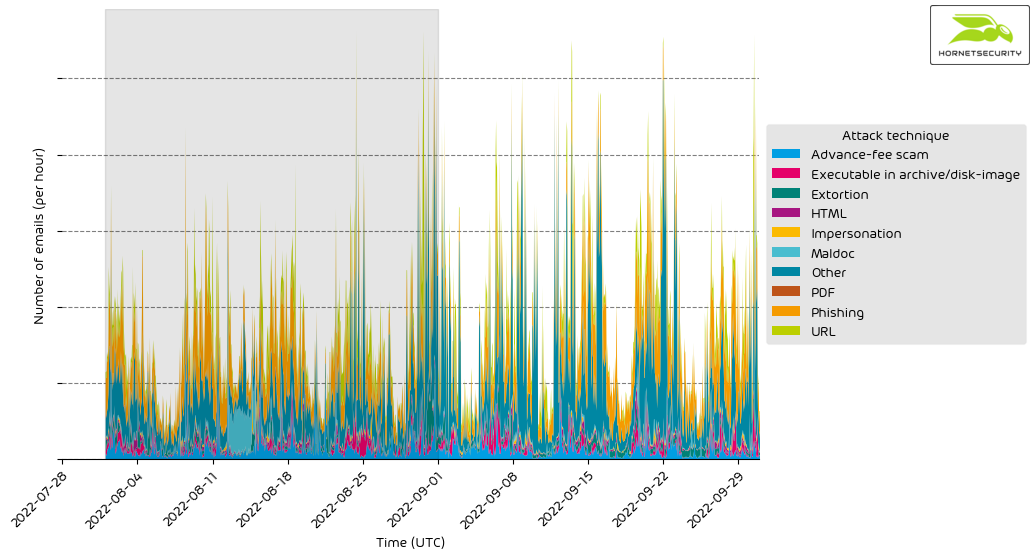
Attack techniques
The following table shows the attack techniques used in attacks.
| Attack technique | % |
| Phishing | 26.3 |
| URL | 9.9 |
| Advance-fee scam | 6.1 |
| Extortion | 4.2 |
| Executable in archive/disk-image | 3.5 |
| HTML | 2.1 |
| Impersonation | 1.1 |
| Maldoc | 0.7 |
| 0.1 | |
| Other | 46.2 |
The following histogram shows the email volume per attack technique used per hour.
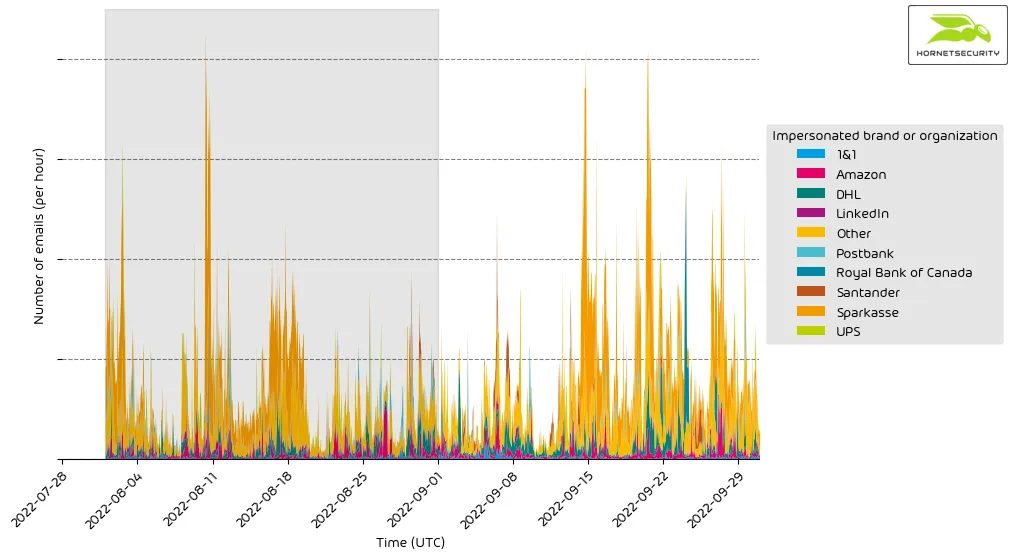
Impersonated company brands and organizations
The following table shows which company brands and organizations our systems detected most in impersonation attacks.
| Impersonated brand or organization | % |
| Sparkasse | 35.7 |
| DHL | 11.1 |
| Amazon | 7.1 |
| Santander | 3.9 |
| Royal Bank of Canada | 3.2 |
| 2.3 | |
| Fedex | 1.9 |
| 1&1 | 1.8 |
| Postbank | 1.7 |
| Targobank | 1.5 |
| UPS | 1.3 |
| Microsoft | 1.3 |
| Commerzbank | 1.2 |
| HSBC | 1.2 |
| Intuit | 1.1 |
| American Express | 1.0 |
| Other | 23.7 |
The following histogram shows the email volume for brands and organizations detected in impersonation attacks per hour.
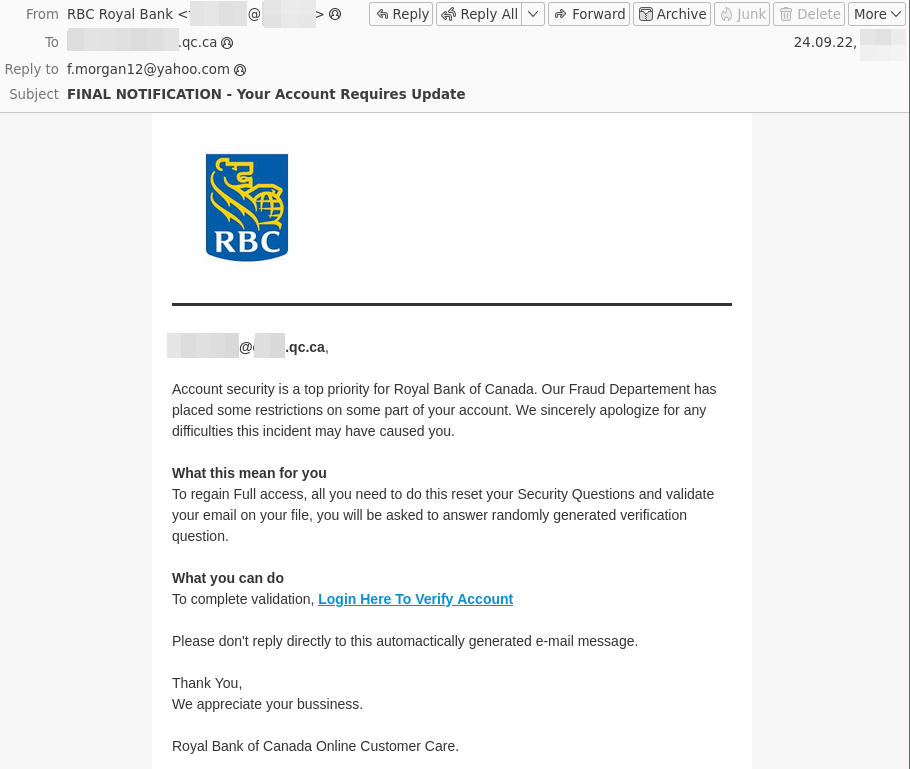
Highlighted threat email campaigns
Around 2022-09-24, we observed a large-scale phishing campaign impersonating the Royal Bank of Canada.