Email Threat Review August 2022
Contents
In this monthly email threat review instalment, we present an overview of the email-based threats observed in August 2022 and compare them to the previous month’s threats.
The report provides insights into:
- Unwanted emails by category
- File types used in attacks
- Industry Email Threat Index
- Attack techniques
- Impersonated company brands and organizations
Unwanted emails by category
The following table shows the distribution of unwanted emails per category.
| Email category | % |
| Rejected | 81.01 |
| Spam | 14.03 |
| Threat | 3.29 |
| AdvThreat | 1.62 |
| Content | 0.04 |
The following histogram shows the email volume per category per day.

Methodology
The listed email categories correspond to those listed in the Email Live Tracking of Hornetsecurity’s Control Panel. So our users are already familiar with them. For others, the categories are:
| Category | Description |
| Spam | These emails are unwanted and are often promotional or fraudulent. The emails are sent simultaneously to a large number of recipients. |
| Content | These emails have an invalid attachment. The administrators define in the Content Control module which attachments are invalid. |
| Threat | These emails contain harmful content, such as malicious attachments or links, or they are sent to commit crimes like phishing. |
| AdvThreat | Advanced Threat Protection has detected a threat in these emails. The emails are used for illegal purposes and involve sophisticated technical means that can only be fended off using advanced dynamic procedures. |
| Rejected | Our email server rejects these emails directly during the SMTP dialog because of external characteristics, such as the sender’s identity, and the emails are not analyzed further. |
File types used in attacks
The following table shows the distribution of file types used in attacks.
| File type (used in malicious emails) | % |
| Word | 26.1 |
| HTML | 22.2 |
| Archive | 20.7 |
| 12.5 | |
| Disk image files | 7.2 |
| Executable | 4.2 |
| Excel | 4.0 |
| Script file | 0.7 |
| Other | 2.5 |
The following histogram shows the email volume per file type used in attacks per 7 days.

HTML attachments used in attacks increased further from 14.8% to 22.2%. As of last month, we attribute this increase to Microsoft’s recent changes to disable Macros in Microsoft Office documents by default. Excel files continued to decrease from 5.1% to 4.0%.
The increase in Word documents used in attacks from 5.1% to 26.1% can mainly be attributed to a malicious email campaign using an RTF attachment exploiting the CVE-2018-0798 vulnerability to distribute the Snake Keylogger malware. Most of the emails were sent to a minimal number of recipients, with several hundred thousand duplicate emails of this campaign being sent to each such recipient. All of which Hornetsecurity’s filters detected and quarantined, of course.
Industry Email Threat Index
The following table shows our Industry Email Threat Index calculated based on the number of threat emails compared to each industry’s clean emails (in median).
| Industries | Share of threat in threat and clean emails |
| Research industry | 5.8 |
| Transport industry | 4.7 |
| Education industry | 4.3 |
| Manufacturing industry | 4.2 |
| Entertainment industry | 4.1 |
| Media industry | 4.1 |
| Utilities | 3.9 |
| Retail industry | 3.7 |
| Healthcare industry | 3.7 |
| Construction industry | 3.6 |
The following bar chart visualizes the email-based threat posed to each industry.
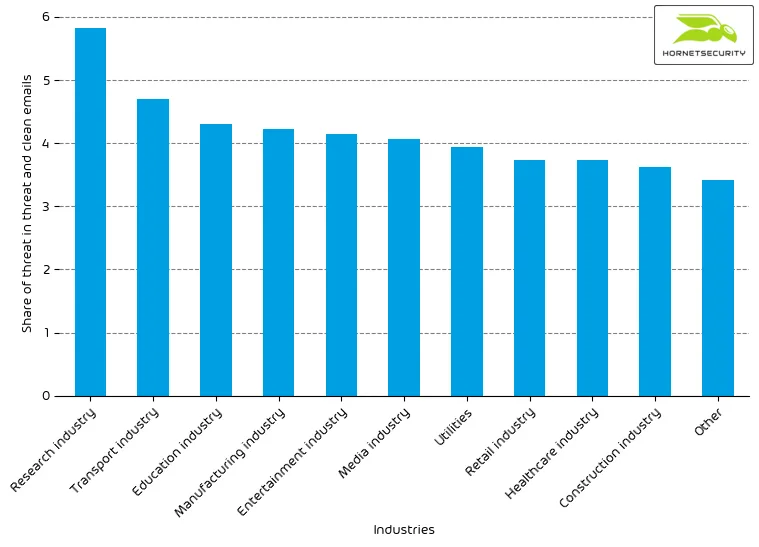
The overall Industry Email Threat Index increased slightly from last month. The research industry increased over-proportionally from 4.8% to 5.8%. Another significant increase could be measured in the education industry, which increased from 3.6% to 4.3%, from 8th to 3rd place.
Methodology
Different (sized) organizations receive a different absolute number of emails. Thus, we calculate the per cent share of threat emails from each organization’s threat and clean emails to compare organizations. We then calculate the median of these per cent values for all organizations within the same industry to form the industry’s final threat score.
Attack techniques
The following table shows the attack techniques used in attacks.
| Attack technique | % |
| Phishing | 29.2 |
| URL | 11.4 |
| Advance-fee scam | 9.2 |
| Extortion | 5.0 |
| Maldoc | 3.6 |
| Executable in archive/disk-image | 3.6 |
| HTML | 2.2 |
| Impersonation | 1.1 |
| 0.7 | |
| Other | 34.0 |
The following histogram shows the email volume per attack technique used per hour.
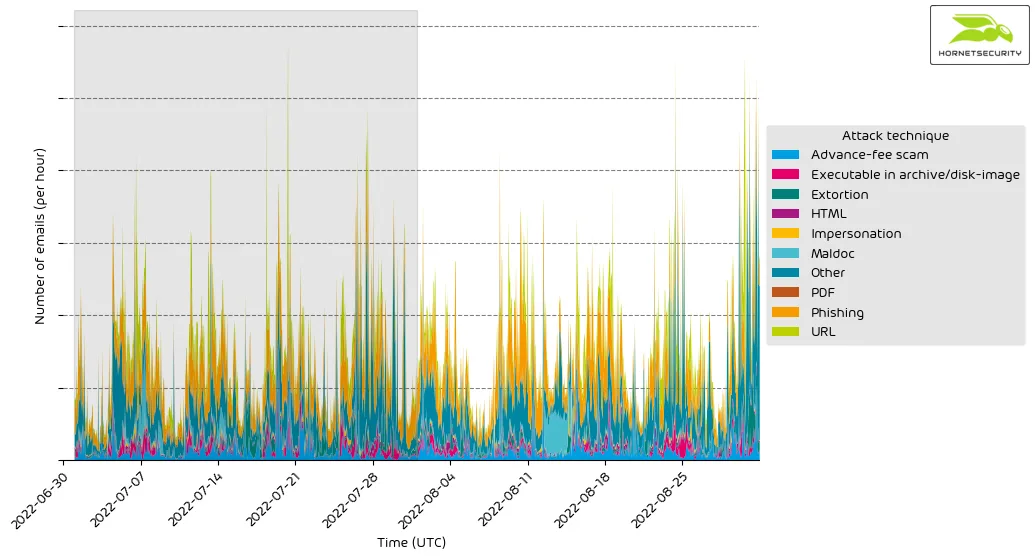
The spike in attacks using malicious documents (maldocs) can be attributed to the previously discussed emails using an RTF attachment exploiting the CVE-2018-0798 vulnerability to distribute the Snake Keylogger malware.
Impersonated company brands and organizations
The following table shows which company brands and organizations our systems detected most in impersonation attacks.
| Impersonated brand or organization | % |
| Sparkasse | 33.4 |
| DHL | 9.9 |
| Amazon | 8.8 |
| Postbank | 3.7 |
| 3.3 | |
| UPS | 3.1 |
| HSBC | 2.3 |
| Dropbox | 1.8 |
| 1&1 | 1.8 |
| DocuSign | 1.7 |
| Strato | 1.4 |
| Santander | 1.4 |
| Intuit | 1.3 |
| Microsoft | 1.3 |
| Fedex | 1.2 |
| Other | 23.6 |
The following histogram shows the email volume for brands and organizations detected in impersonation attacks per hour.
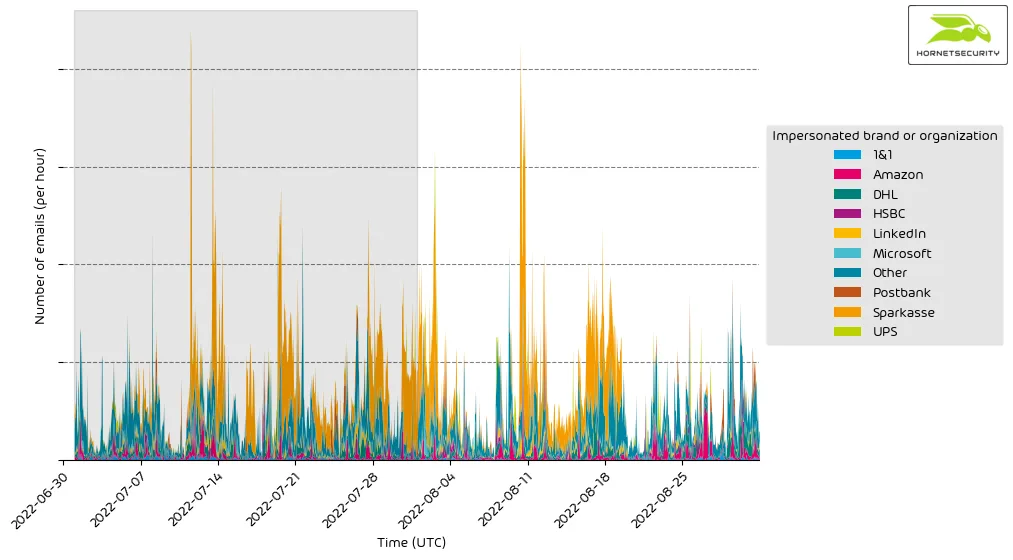
It’s a constant stream of phishing and other attacks impersonating big brands and organizations to entice recipients to open emails.