Email Threat Review July 2021
Summary
In this installment of our monthly email threat review, we present an overview of the email-based threats observed in July 2021 and compare them to the previous month’s threats.
The report provides insights into:
- Unwanted emails by category
- File types used in attacks
- Industry Email Threat Index
- Attack techniques
- Impersonated company brands and organizations
- Highlighted threat email campaigns
- Ransomleaks
Unwanted emails by category
The following table shows the distribution of unwanted emails per category.
| Email category | % |
| Rejected | 84.05 |
| Spam | 11.99 |
| Threat | 3.02 |
| AdvThreat | 0.91 |
| Content | 0.03 |
The following time histogram shows the email volume per category per day.

The spike in rejected emails on 2021-07-30 can be attributed to the monthly reoccurring sextortion scam email campaign written in German that caused similar spikes in previous months.
Methodology
The listed email categories correspond to the email categories listed in the Email Live Tracking of Hornetsecurity’s Control Panel. So our users are already familiar with them. For others, the categories are:
| Category | Description |
| Spam | These emails are unwanted and are often promotional or fraudulent. The emails are sent simultaneously to a large number of recipients. |
| Content | These emails have an invalid attachment. The administrators define in the Content Control module which attachments are invalid. |
| Threat | These emails contain harmful content, such as malicious attachments or links, or they are sent to commit crimes like phishing. |
| AdvThreat | Advanced Threat Protection has detected a threat in these emails. The emails are used for illegal purposes and involve sophisticated technical means that can only be fended off using advanced dynamic procedures. |
| Rejected | Our email server rejects these emails directly during the SMTP dialog because of external characteristics, such as the sender’s identity, and the emails are not analyzed further. |
File types used in attacks
The following table shows the distribution of file types used in attacks.
| File type (used in malicious emails) | % |
| Archive | 30.0 |
| 20.8 | |
| HTML | 17.1 |
| Executable | 11.7 |
| Excel | 7.0 |
| Word | 5.4 |
| Other | 4.3 |
| Disk image files | 3.3 |
| Script file | 0.1 |
| Powerpoint | 0.1 |
| 0.0 | |
| LNK file | 0.0 |
The following time histogram shows the email volume per file type used in attacks per 7 days.

Here we see an increase in malicious Word documents being used in attacks. In the previous month, only 3.6 % of attacks used Word documents. Word documents used to be the dominant document format used in document-based attacks. However, in 2020 many threat actors switched to Excel documents using the old Excel 4.0 macro feature to execute malicious code, causing the number of malicious Word documents used in attacks to decrease. Security vendors significantly less detected Excel 4.0 macro attacks compared to VBA macro-based attacks. However, since Microsoft has added Excel 4.0 macro support to AMSI1 the increase in malicious Word documents could mean that threat actors may be considering switching back to using predominantly Word documents in their document-based attacks again instead of Excel documents.
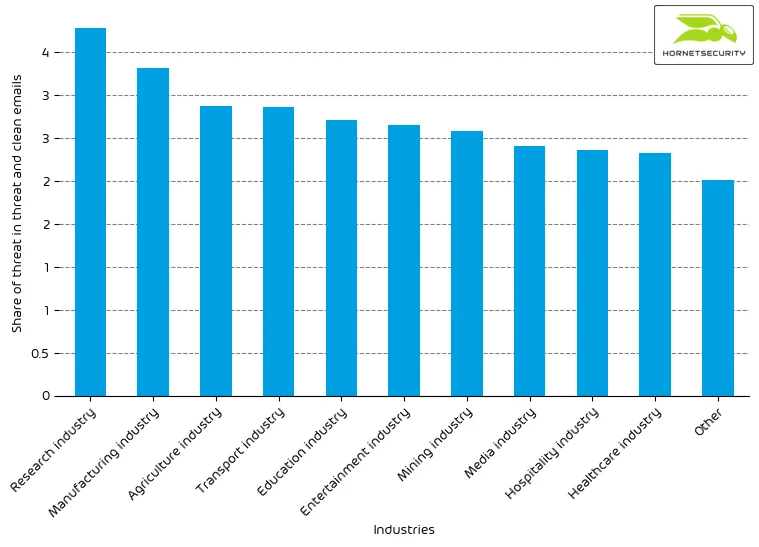
Industry Email Threat Index
The following table shows our Industry Email Threat Index calculated based on the number of threat emails compared to clean emails received (in median) by each industry.
| Industries | Share of threat in threat and clean emails |
| Research industry | 4.3 |
| Manufacturing industry | 3.8 |
| Agriculture industry | 3.4 |
| Transport industry | 3.4 |
| Education industry | 3.2 |
| Entertainment industry | 3.1 |
| Mining industry | 3.1 |
| Media industry | 2.9 |
| Hospitality industry | 2.9 |
| Healthcare industry | 2.8 |
The following bar chart visualizes the email-based threat posed to each industry.
For comparison last month’s email-based threat index bar chart:
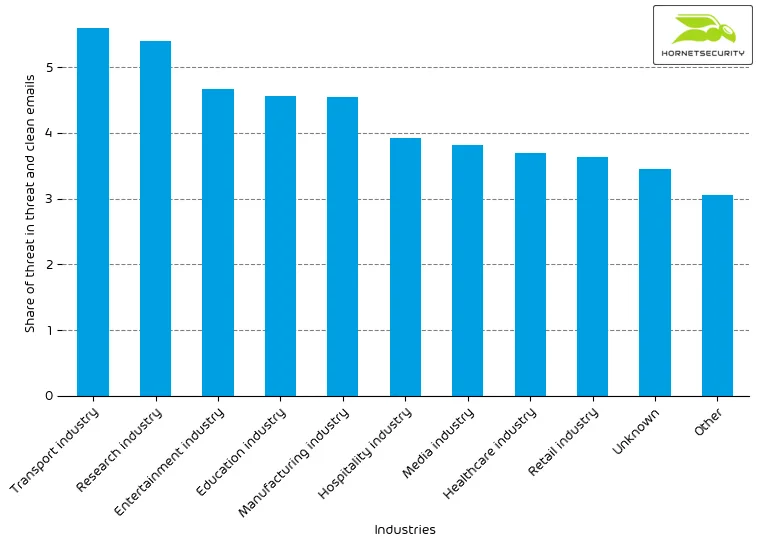
We observe a decrease in the overall email threat score.
Methodology
Different (sized) organizations receive a different absolute number of emails. Thus, we calculate the percent share of threat emails from each organization’s threat and clean emails to compare organizations. We then calculate the median of these percent values for all organizations within the same industry to form the industry’s final threat score.
Attack techniques
The following table shows the attack techniques used in attacks.
| Attack technique | % |
| Other | 53.2 |
| Phishing | 24.2 |
| URL | 8.1 |
| Executable in archive/disk-image | 4.7 |
| Advance-fee scam | 3.7 |
| Extortion | 2.8 |
| Impersonation | 2.2 |
| Maldoc | 1.1 |
| LNK | 0.0 |
The following time histogram shows the email volume per attack technique used per hour.
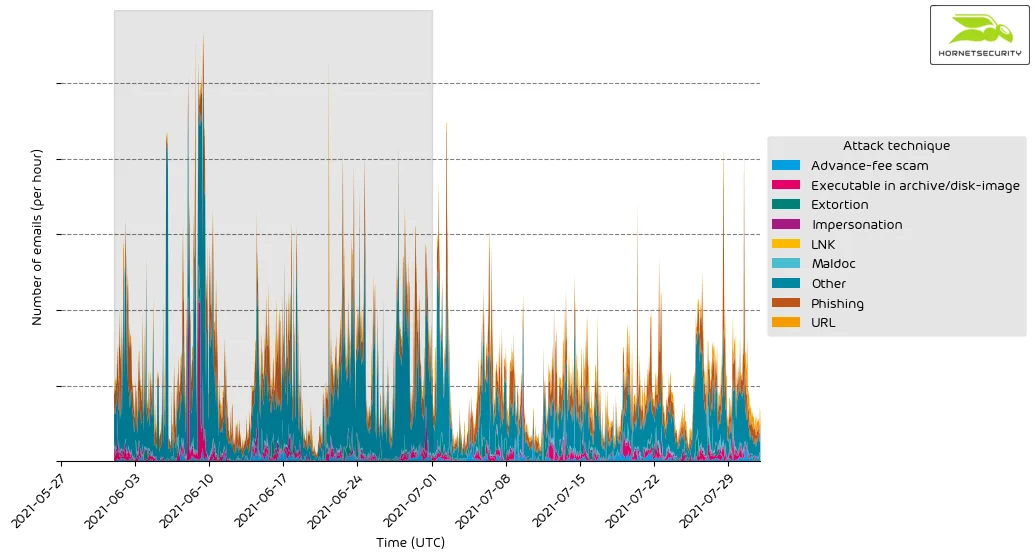
There are no significant anomalies.
Impersonated company brands and organizations
The following table shows which company brands and organizations our systems detected most in impersonation attacks.
| Impersonated brand or organization | % |
| DocuSign | 20.5 |
| PayPal | 13.4 |
| Deutsche Post / DHL | 12.4 |
| Amazon | 11.7 |
| 4.3 | |
| Microsoft | 2.5 |
| HSBC | 2.2 |
| Santander | 2.2 |
| O2 | 1.7 |
| Volks- und Raiffeisenbank | 1.6 |
The following histogram shows the email volume for company brands and organizations detected in impersonation attacks per hour.
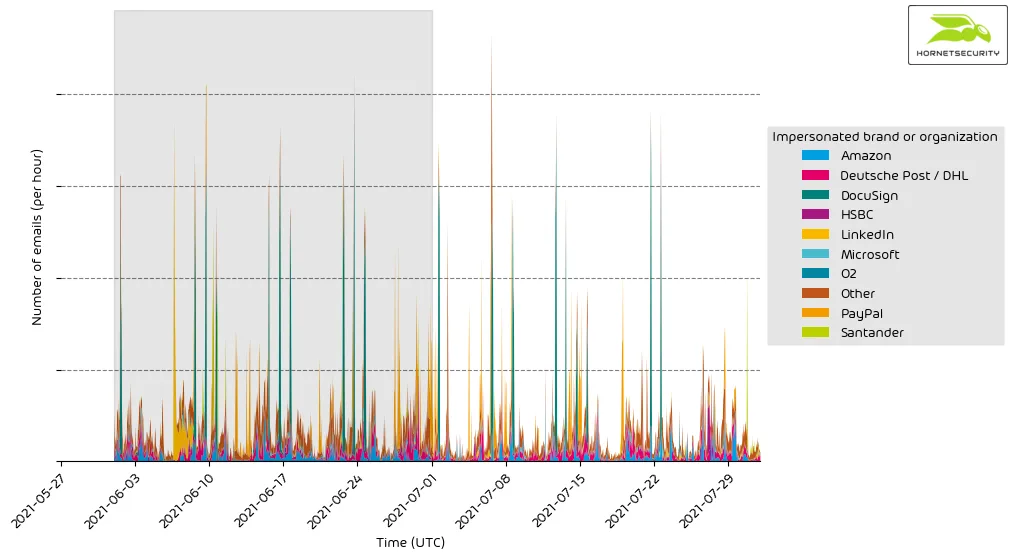
It’s a constant stream of phishing and other attacks impersonating big brands and organizations to entice recipients to open the emails.
Highlighted threat email campaigns
In this section, we want to highlight some malspam campaigns of prominent, well-known threat actors.
Please be advised that this does not contain all campaigns. The ranking, as well as volume figures, should therefore not be taken as a global ranking. We strive to expand this section of our reporting in the future.
The following time histogram shows the email volume for highlighted threat email campaigns per hour.
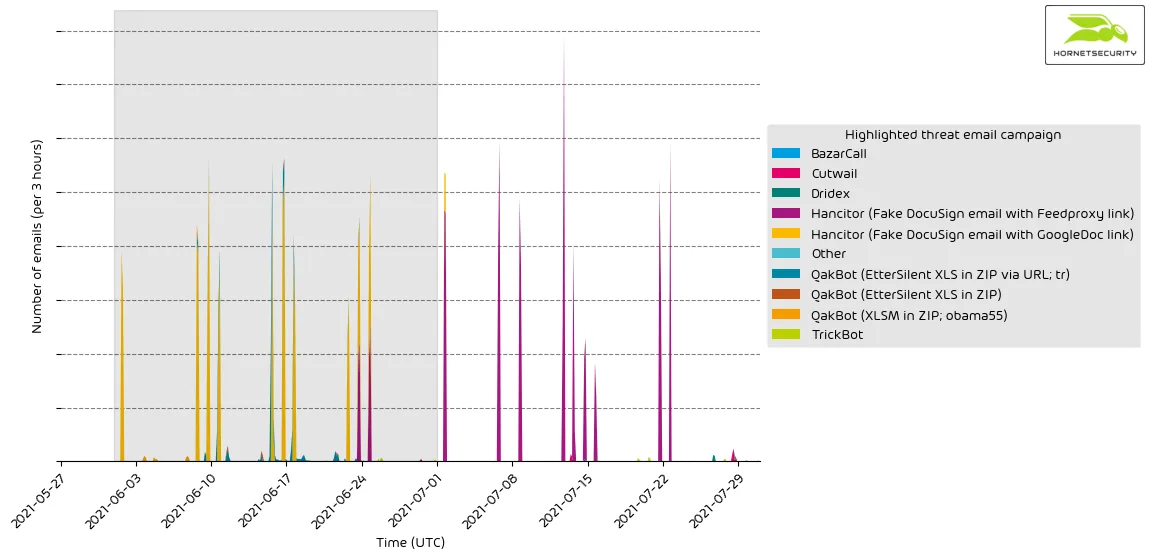
Methodology
Hornetsecurity observes thousands of different threat email campaigns of varying threat actors ranging from very unsophisticated low-effort attacks to highly complex obfuscated attack schemes. Our highlighting includes only a subset of those threat email campaigns.
Ransomleaks
Threat actors continue to leak data stolen from ransomware victims to pressure them to pay for decrypting the files and not publishing sensible data. We observed the following number of leaks on ransomware leak sites:
| Leak site | Number of victim data leaks |
| LockBit 2.0 | 66 |
| Conti | 36 |
| Hive | 16 |
| Synack | 11 |
| Lorenz | 8 |
| REvil | 7 |
| Everest | 5 |
| Promethous | 5 |
| Vice Society | 4 |
| Grief | 3 |
| RansomEXX | 3 |
| Cl0p | 2 |
| LV | 2 |
| RagnarLocker | 2 |
| Xing Team | 2 |
| Nephilim | 1 |
The following bar chart visualizes the number of victim data leaks per leak site.
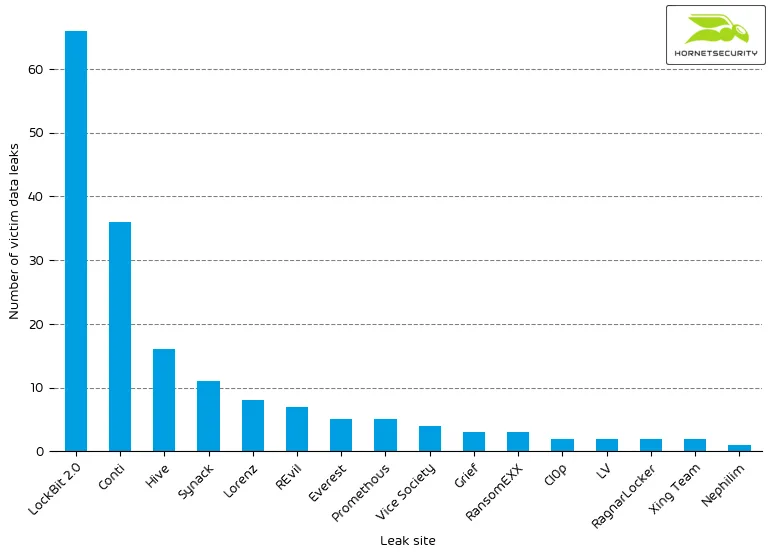
A new addition to our data set is the leak site of LockBit 2.0. The site has been up already in June, and the actors behind the site were looking for affiliates.
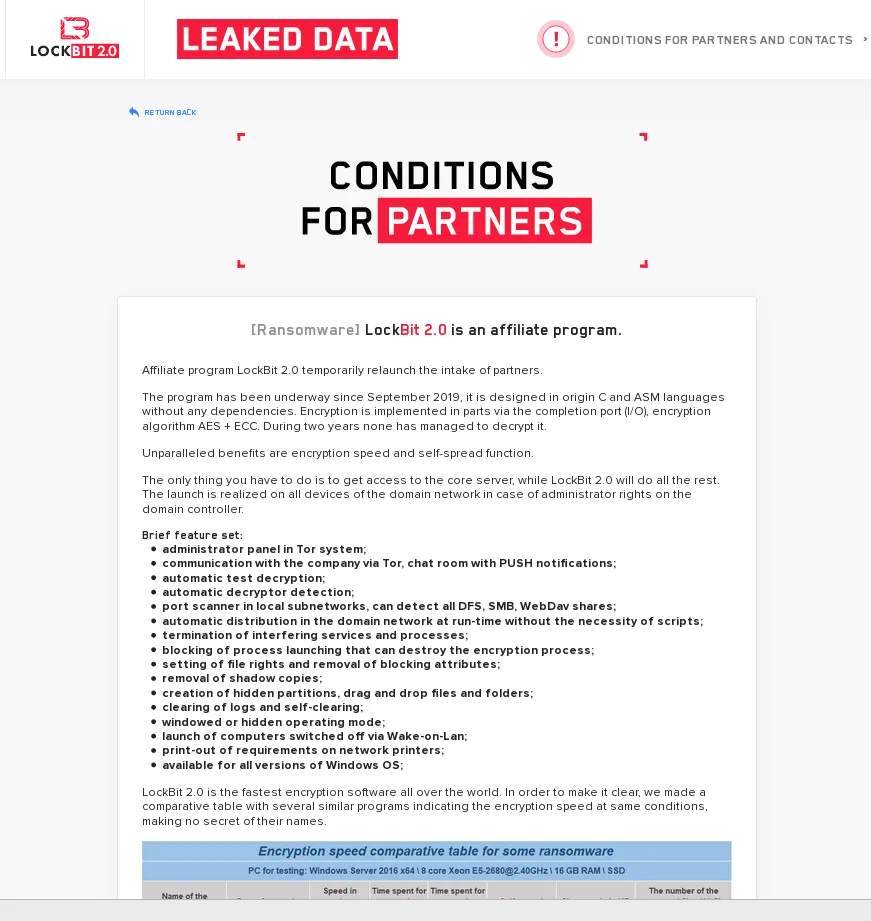
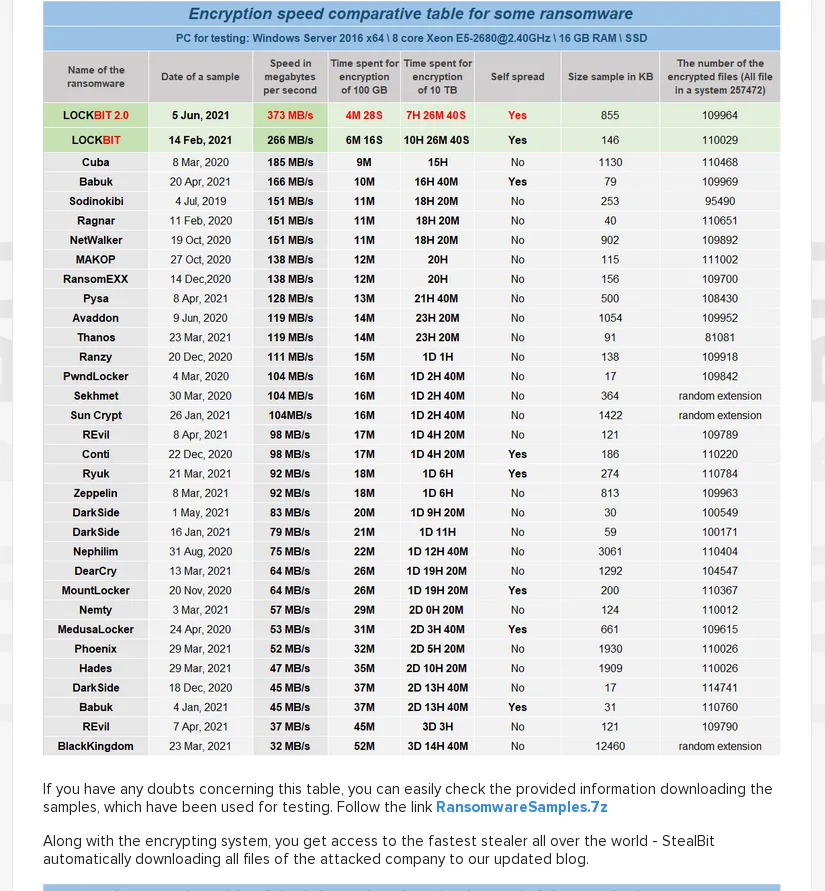
It offered its potentials partners in crime a performance comparison of the LockBit 2.0 ransomware compared to other RaaS (ransomware-as-a-service) offerings.
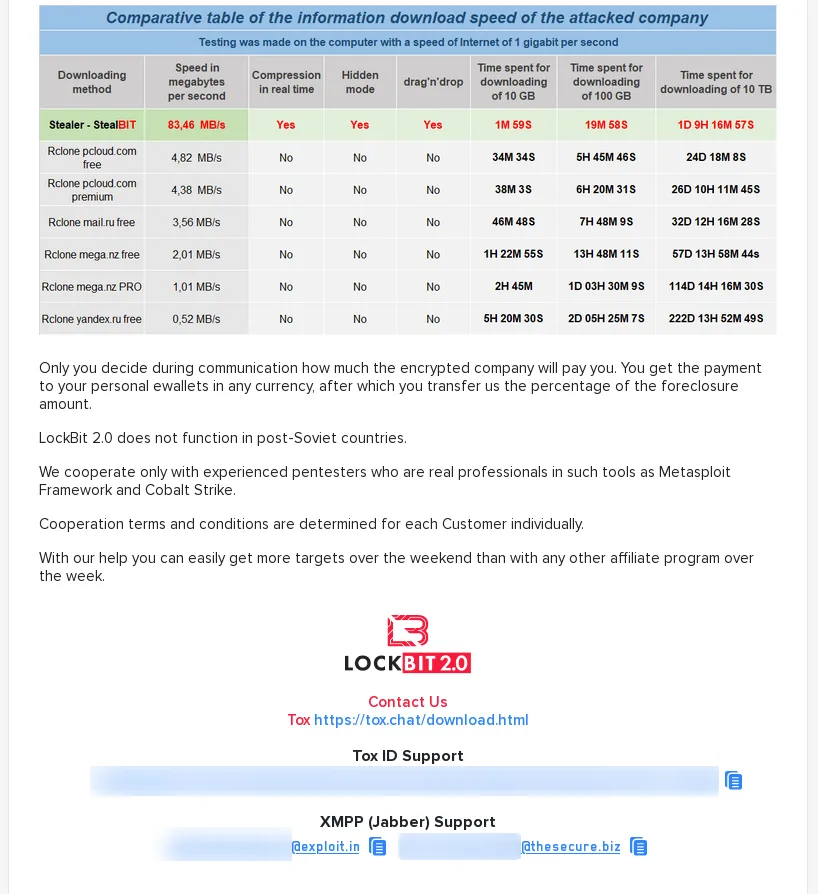
It also offered a comparison of transfer speeds for data exfiltration.
Then on 2021-07-13, the leak site started posting data of victims.
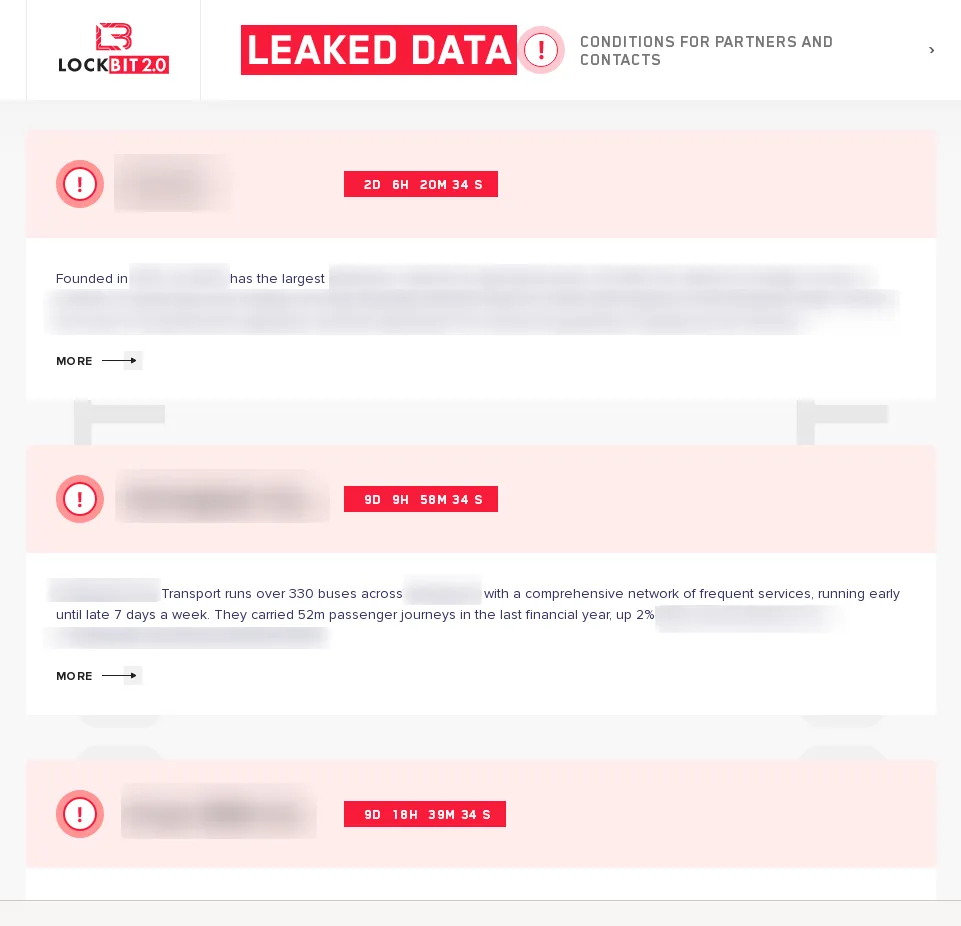
With 66 victims, LockBit 2.0 announced almost twice as many victims as Conti, the leak site with the second most victims this month.