Email Threat Review January 2022
Summary
In this installment of our monthly email threat review, we present an overview of the email-based threats observed in January 2022 and compare them to the previous month’s threats.
The report provides insights into:
- Unwanted emails by category
- File types used in attacks
- Industry Email Threat Index
- Attack techniques
- Impersonated company brands and organizations
Unwanted emails by category
The following table shows the distribution of unwanted emails per category.
| Email category | % |
| Rejected | 79.84 |
| Spam | 15.33 |
| Threat | 4.01 |
| AdvThreat | 0.78 |
| Content | 0.04 |
The following time histogram shows the email volume per category per day.

Methodology
The listed email categories correspond to the email categories listed in the Email Live Tracking of Hornetsecurity’s Control Panel. So our users are already familiar with them. For others, the categories are:
| Category | Description |
| Spam | These emails are unwanted and are often promotional or fraudulent. The emails are sent simultaneously to a large number of recipients. |
| Content | These emails have an invalid attachment. The administrators define in the Content Control module which attachments are invalid. |
| Threat | These emails contain harmful content, such as malicious attachments or links, or they are sent to commit crimes like phishing. |
| AdvThreat | Advanced Threat Protection has detected a threat in these emails. The emails are used for illegal purposes and involve sophisticated technical means that can only be fended off using advanced dynamic procedures. |
| Rejected | Our email server rejects these emails directly during the SMTP dialog because of external characteristics, such as the sender’s identity, and the emails are not analyzed further. |
File types used in attacks
The following table shows the distribution of file types used in attacks.
| File type (used in malicious emails) | % |
| HTML | 38.9 |
| Archive | 23.2 |
| 12.0 | |
| Excel | 10.3 |
| Disk image files | 5.0 |
| Executable | 4.2 |
| Other | 3.1 |
| Word | 2.7 |
| Script file | 0.4 |
| LNK file | 0.2 |
| 0.1 | |
| Powerpoint | 0.0 |
There is an increase in HTML attachments used in attacks from 22.8 % to 38.9 % from last month.
Industry Email Threat Index
The following table shows our Industry Email Threat Index calculated based on the number of threat emails compared to each industry’s clean emails (in median).
| Industries | Share of threat in threat and clean emails |
| Research industry | 6.8 |
| Entertainment industry | 6.4 |
| Healthcare industry | 5.3 |
| Education industry | 5.3 |
| Mining industry | 5.2 |
| Manufacturing industry | 4.9 |
| Media industry | 4.7 |
| Automotive industry | 4.5 |
| Hospitality industry | 4.3 |
| Construction industry | 4.2 |
The following bar chart visualizes the email-based threat posed to each industry.
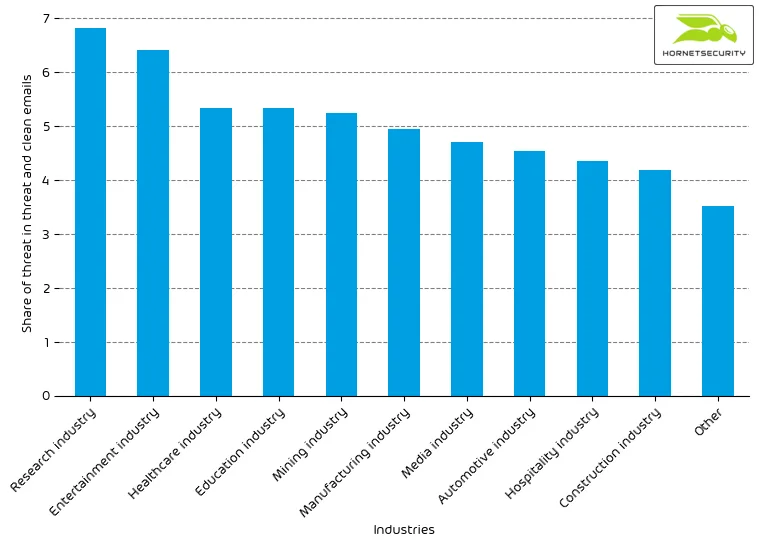
The research industry’s threat emails share increased from 4.1 % to 6.8 % last month. Making the research industry again the industry most threatened by email attacks.
The global median threat email share over all companies regardless of industry increased from 3.2 % to 3.7 %. This indicates that the increase in threat email share targeting the research industry is higher than the overall increase in threat email share.
Methodology
Different (sized) organizations receive a different absolute number of emails. Thus, we calculate the percent share of threat emails from each organization’s threat and clean emails to compare organizations. We then calculate the median of these percent values for all organizations within the same industry to form the industry’s final threat score.
Attack techniques
The following table shows the attack techniques used in attacks.
| Attack technique | % |
| Phishing | 43.5 |
| Other | 34.0 |
| URL | 10.1 |
| Impersonation | 3.7 |
| Extortion | 3.5 |
| Advance-fee scam | 2.3 |
| Executable in archive/disk-image | 2.0 |
| Maldoc | 0.8 |
| LNK | 0.0 |
The following time histogram shows the email volume per attack technique used per hour.
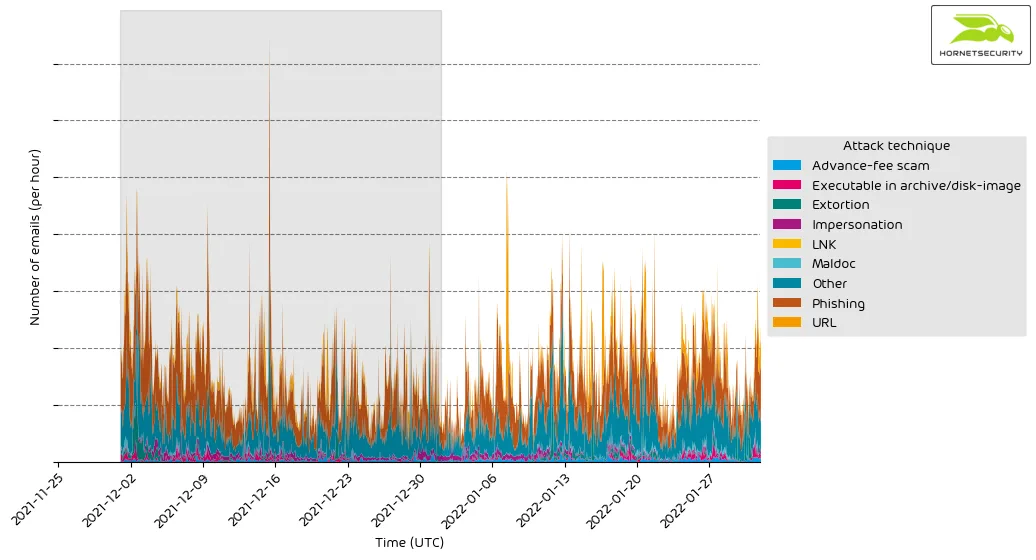
The increase in URL-based attacks from last month’s 7.3 % to 10.1 % can be attributed to Emotet URL-based malspam campaigns.
Impersonated company brands and organizations
The following table shows which company brands and organizations our systems detected most in impersonation attacks.
| Impersonated brand or organization | % |
| Volks- und Raiffeisenbank | 61.2 |
| Other | 10.3 |
| Sparkasse | 9.7 |
| Amazon | 6.0 |
| Postbank | 5.9 |
| Deutsche Post / DHL | 4.1 |
| Microsoft | 0.9 |
| UPS | 0.8 |
| 1&1 | 0.6 |
| Commerzbank | 0.4 |
The following histogram shows the email volume for company brands and organizations detected in impersonation attacks per hour.
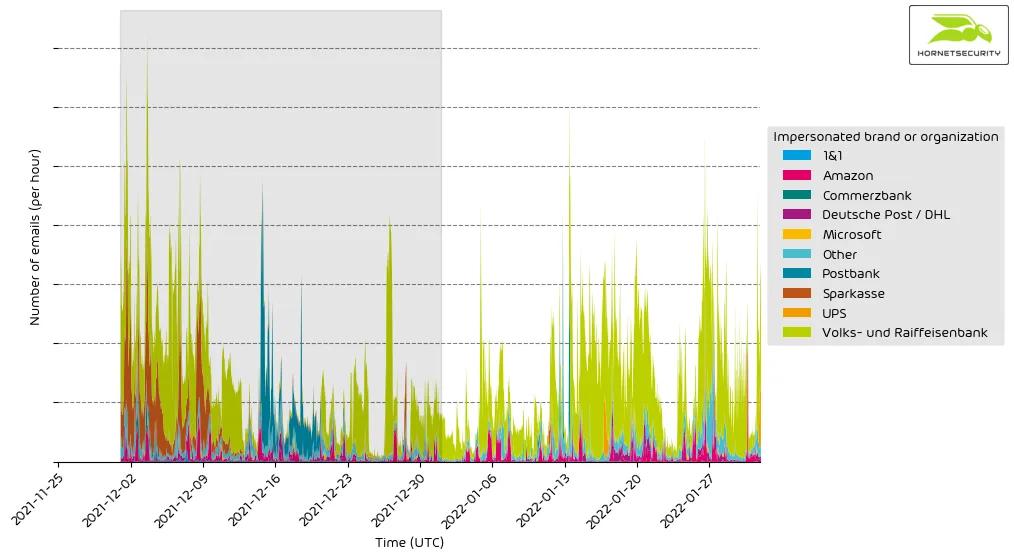
In September 2021, we first reported a large-scale phishing campaign that mimicked emails from German banks. Since then, the campaign has been ongoing. This month the campaign focused heavily on the Volks- und Raiffeisenbank brand. Consequently, the brand has been the most impersonated brand of January 2022. It attributed to 61.2% of all brand impersonation attacks.